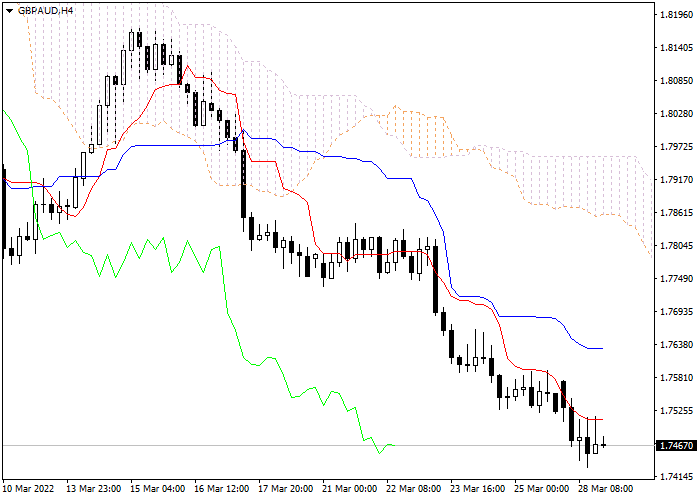
Let's look at the four-hour chart. Tenkan-sen line is below Kijun-sen, the lines are horizontal . Confirmative line Chikou Span is below the price chart, current cloud is descending. The instrument is trading below Tenkan-sen and Kijun-sen lines; the Bearish trend is still strong. One of the previous minimums of Chikou Span line is expected to be a support level (1.7212). The closest resistance level is Kijun-sen line (1.7536).
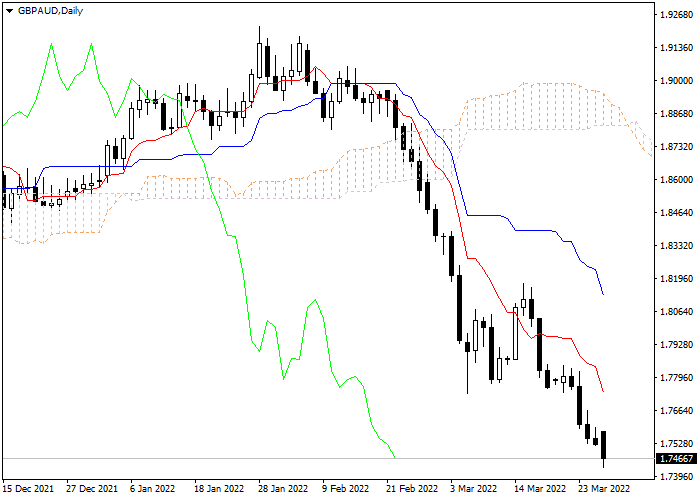
On the daily chart Tenkan-sen line is below Kijun-sen, both lines are directed downwards. Confirmative line Chikou Span is below the price chart, current cloud is descending. The instrument is trading below Tenkan-sen and Kijun-sen lines; the Bearish trend is still strong. One of the previous minimums of Chikou Span line is expected to be a support level (1.7180). The closest resistance level is Tenkan-sen line (1.7731).
On the both charts the instrument is still falling. It is recommended to open short positions at current price with Take Profit at the level of previous minimum of Chikou Span line (1.7212) and Stop Loss at the level of Kijun-sen line (1.7536).
Euro to Australian Dollar
| Kauf | Verkauf | Spread |
| 1.67591 | 1.67575 | 16 |
Szenario
| Zeitrahmen | Zeitraum in Tagen |
| Empfehlungen | SELL |
| Einstiegspunkt | 1.7468 |
| Take Profit | 1.7212 |
| Stop Loss | 1.7536 |
| Hauptniveaus | 1.7180, 1.7212, 1.7536, 1.7731 |
Die auf dieser Seite veröffentlichten Materialien werden von dem Unternehmen Claws&Horns in Zusammenarbeit mit LiteForex erstellt und sollten nicht als Anlageberatung im Sinne der Richtlinie 2014/65/EU angesehen werden. Darüber hinaus wurden sie nicht in Übereinstimmung mit den gesetzlichen Anforderungen zur Förderung der Unabhängigkeit von Finanzanalysen erstellt und unterliegen keinem Verbot der Weiterverbreitung von Finanzanalysen.