Wirtschaftskalender
Wirtschaftskalender für Forex und Nachrichten aus aller Welt. Veröffentlichung täglich und wöchentlich
Wöchentliche Forex-Nachrichten und präziser Indikator-Kalender der Weltwirtschaft von LiteForex
Der in Echtzeit aktualisierte Wirtschaftskalender ist ein wichtiges Werkzeug für alle Forex-Trader. Er enthält Informationen über die wichtigsten makroökonomischen Indikatoren und Ereignisse, die bestimmte Finanzinstrumente beeinflussen. Besonders nützlich ist der Wirtschaftskalender für alle Trader, deren Handelsstrategie auf der Fundamentalanalyse basiert. Mit Hilfe des Wirtschaftskalenders sind die Kunden von LiteForex über die aktuellen Nachrichten auf dem neuesten Stand. Damit ist ein ausgewogener und erfolgreicher Handel auf dem Forex-Markt möglich.
Die auf dieser Seite veröffentlichten Materialien werden von LiteForex ausschließlich zu Informationszwecken bereitgestellt und sollten nicht als Anlageberatung oder Beratung im Sinne der Richtlinie 2014/65/EU angesehen werden. Des Weiteren wurden diese Materialien nicht in Übereinstimmung mit den gesetzlichen Anforderungen zur Förderung der Unabhängigkeit von Finanzanalysen erstellt und unterliegen keinem Verbot der Weiterverbreitung von Finanzanalysen.
Forex-Analysen und Marktprognosen
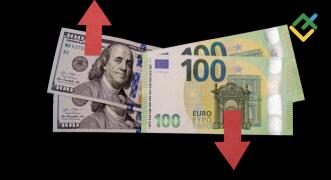

Der Artikel stellt Prognosen für das Währungspaar EURUSD vor, die kurz- und langfristige Erwartungen...

Ist Gold für Sie eine gute Investition? Lesen Sie unsere Goldpreisprognose und treffen Sie Ihre eige...
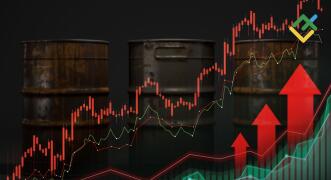
Hier finden Sie die neuesten Preisprognosen für Rohöl für das Jahr 2026 und darüber hinaus. Verfolge...

Ist XAGUSD ein guter Vermögenswert für die Kapitalanlage?

Hier finden Sie die S&P 500 Analyse und Prognose für 2026-2027 mit den langfristigen Aussichten für...
Prognose des Dow Jones von Experten erörtert. Wie wird der zukünftige Kurs des DJIA für heute und mo...